Eight evaluators move as expected
As each targeted acoustic violation becomes more severe, its corresponding consistency score degrades in the expected direction.
AcoustiTrace diagnostic benchmark for audio–video generation
When Plausible Sound Violates Physics
The Acoustic-Process Diagnostic Gap: Current audio–video benchmarks emphasize perceptual quality, semantic alignment, and synchronization, but provide limited support for identifying which acoustic process fails or how severely it departs from a physically expected relation.
AcoustiTrace Benchmark: We introduce a diagnostic benchmark for T2AV and I2AV generation that organizes acoustic physical realism into eight measurable dimensions across sound generation, propagation environment, and acoustic reception.
Dataset & Validated Evaluators: We curate 11,296 unique real-world A/V clips and 82,828 acoustically annotated RGB-D samples, using them to build and validate targeted evaluators and 605-prompt T2AV / 748-prompt I2AV suites.
Findings & Actionability: Across nine joint A/V generators, even strong models still violate fundamental acoustic relations. A range-guided intervention improves the targeted relation in 80.16% of valid samples, showing how diagnostic evidence can guide model refinement.

01 / Benchmark construction
AcoustiTrace asks whether a generated soundtrack follows the acoustic relations implied by visible events and scene conditions. Eight diagnostics trace those relations through sound generation, environmental propagation, and acoustic reception.
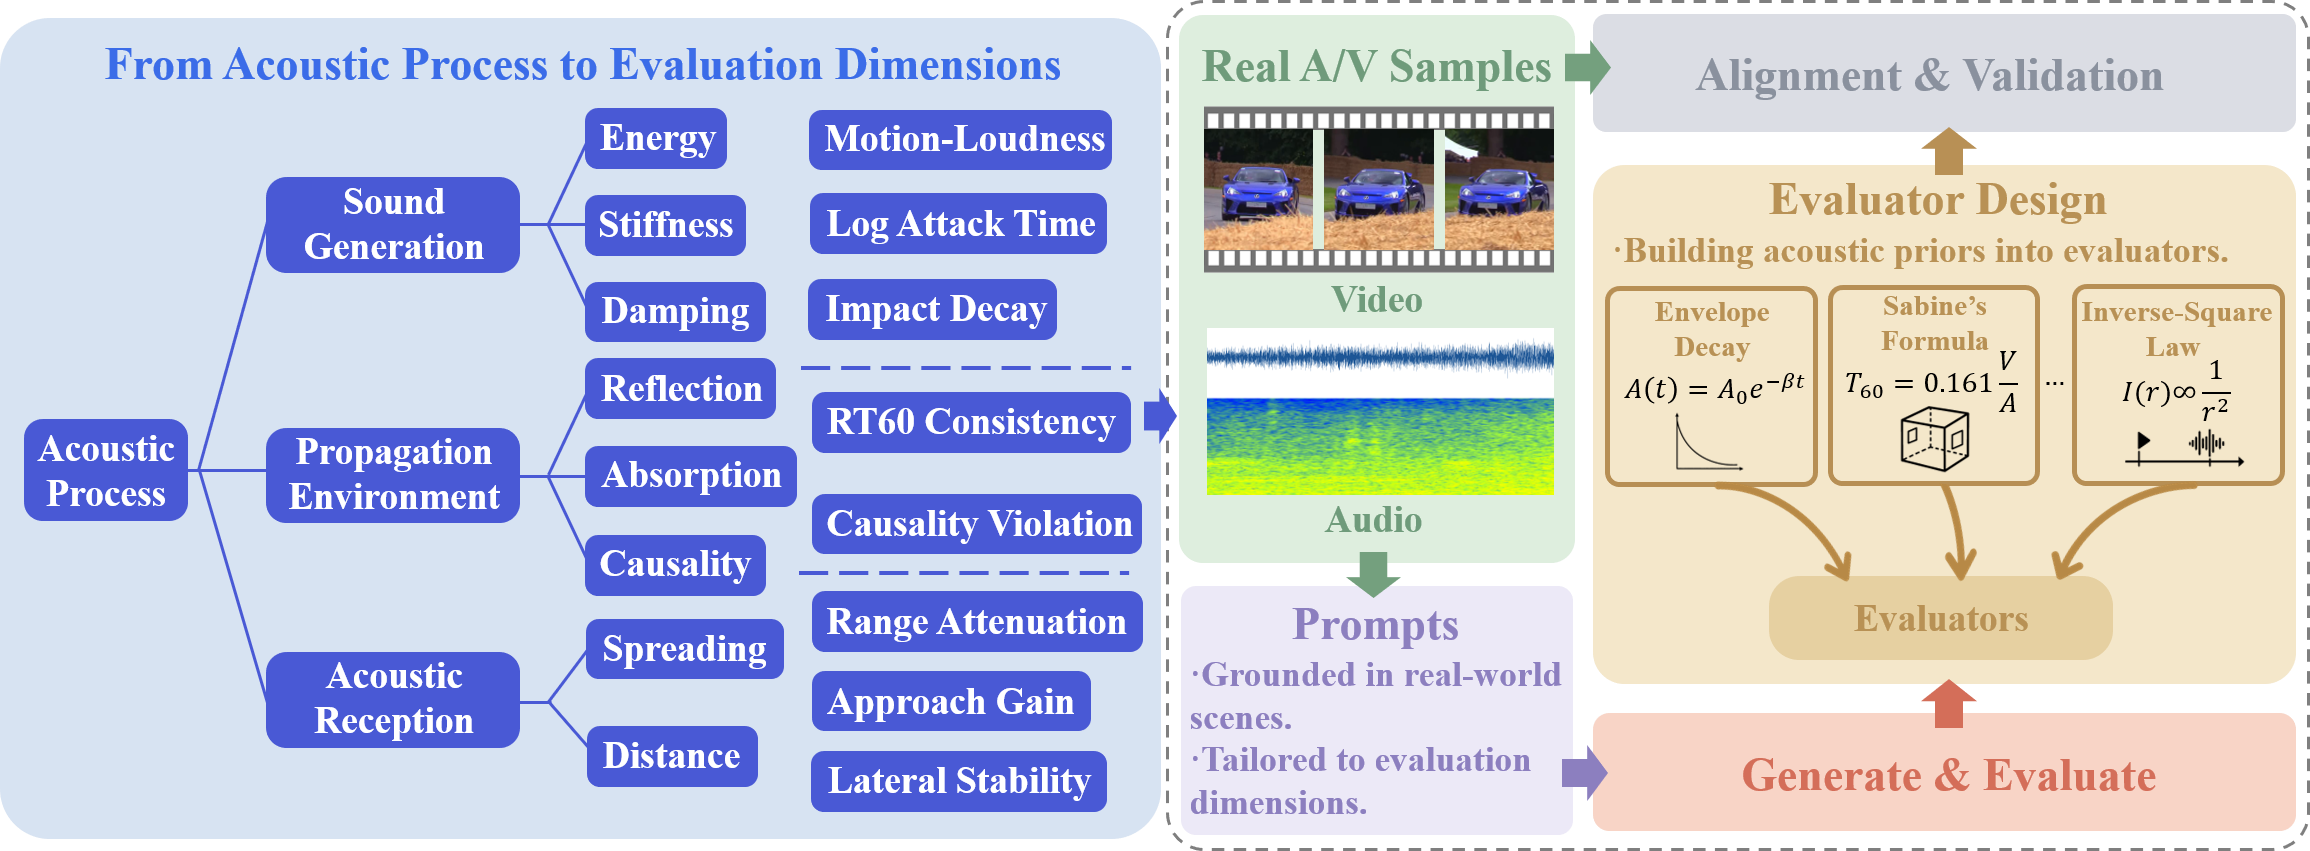
Why this matters. A soundtrack can sound plausible while violating one underlying mechanism; relation-specific scores reveal where that failure occurs.
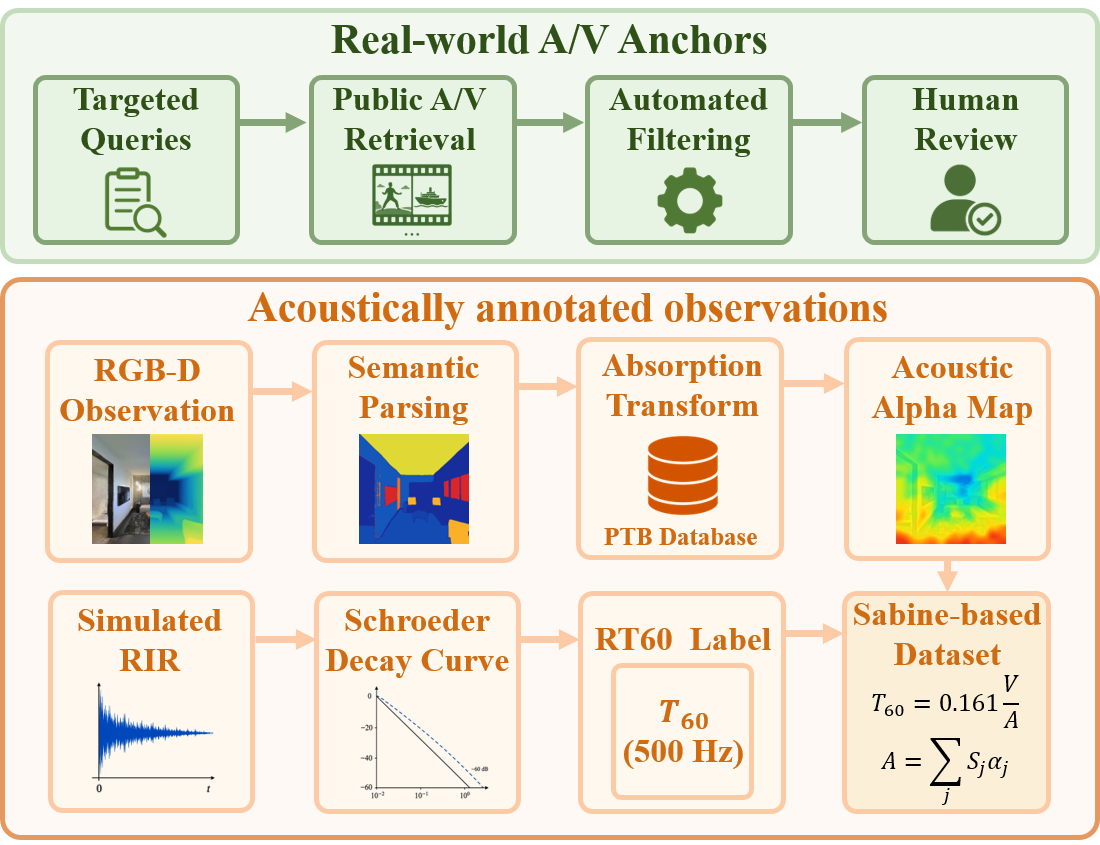
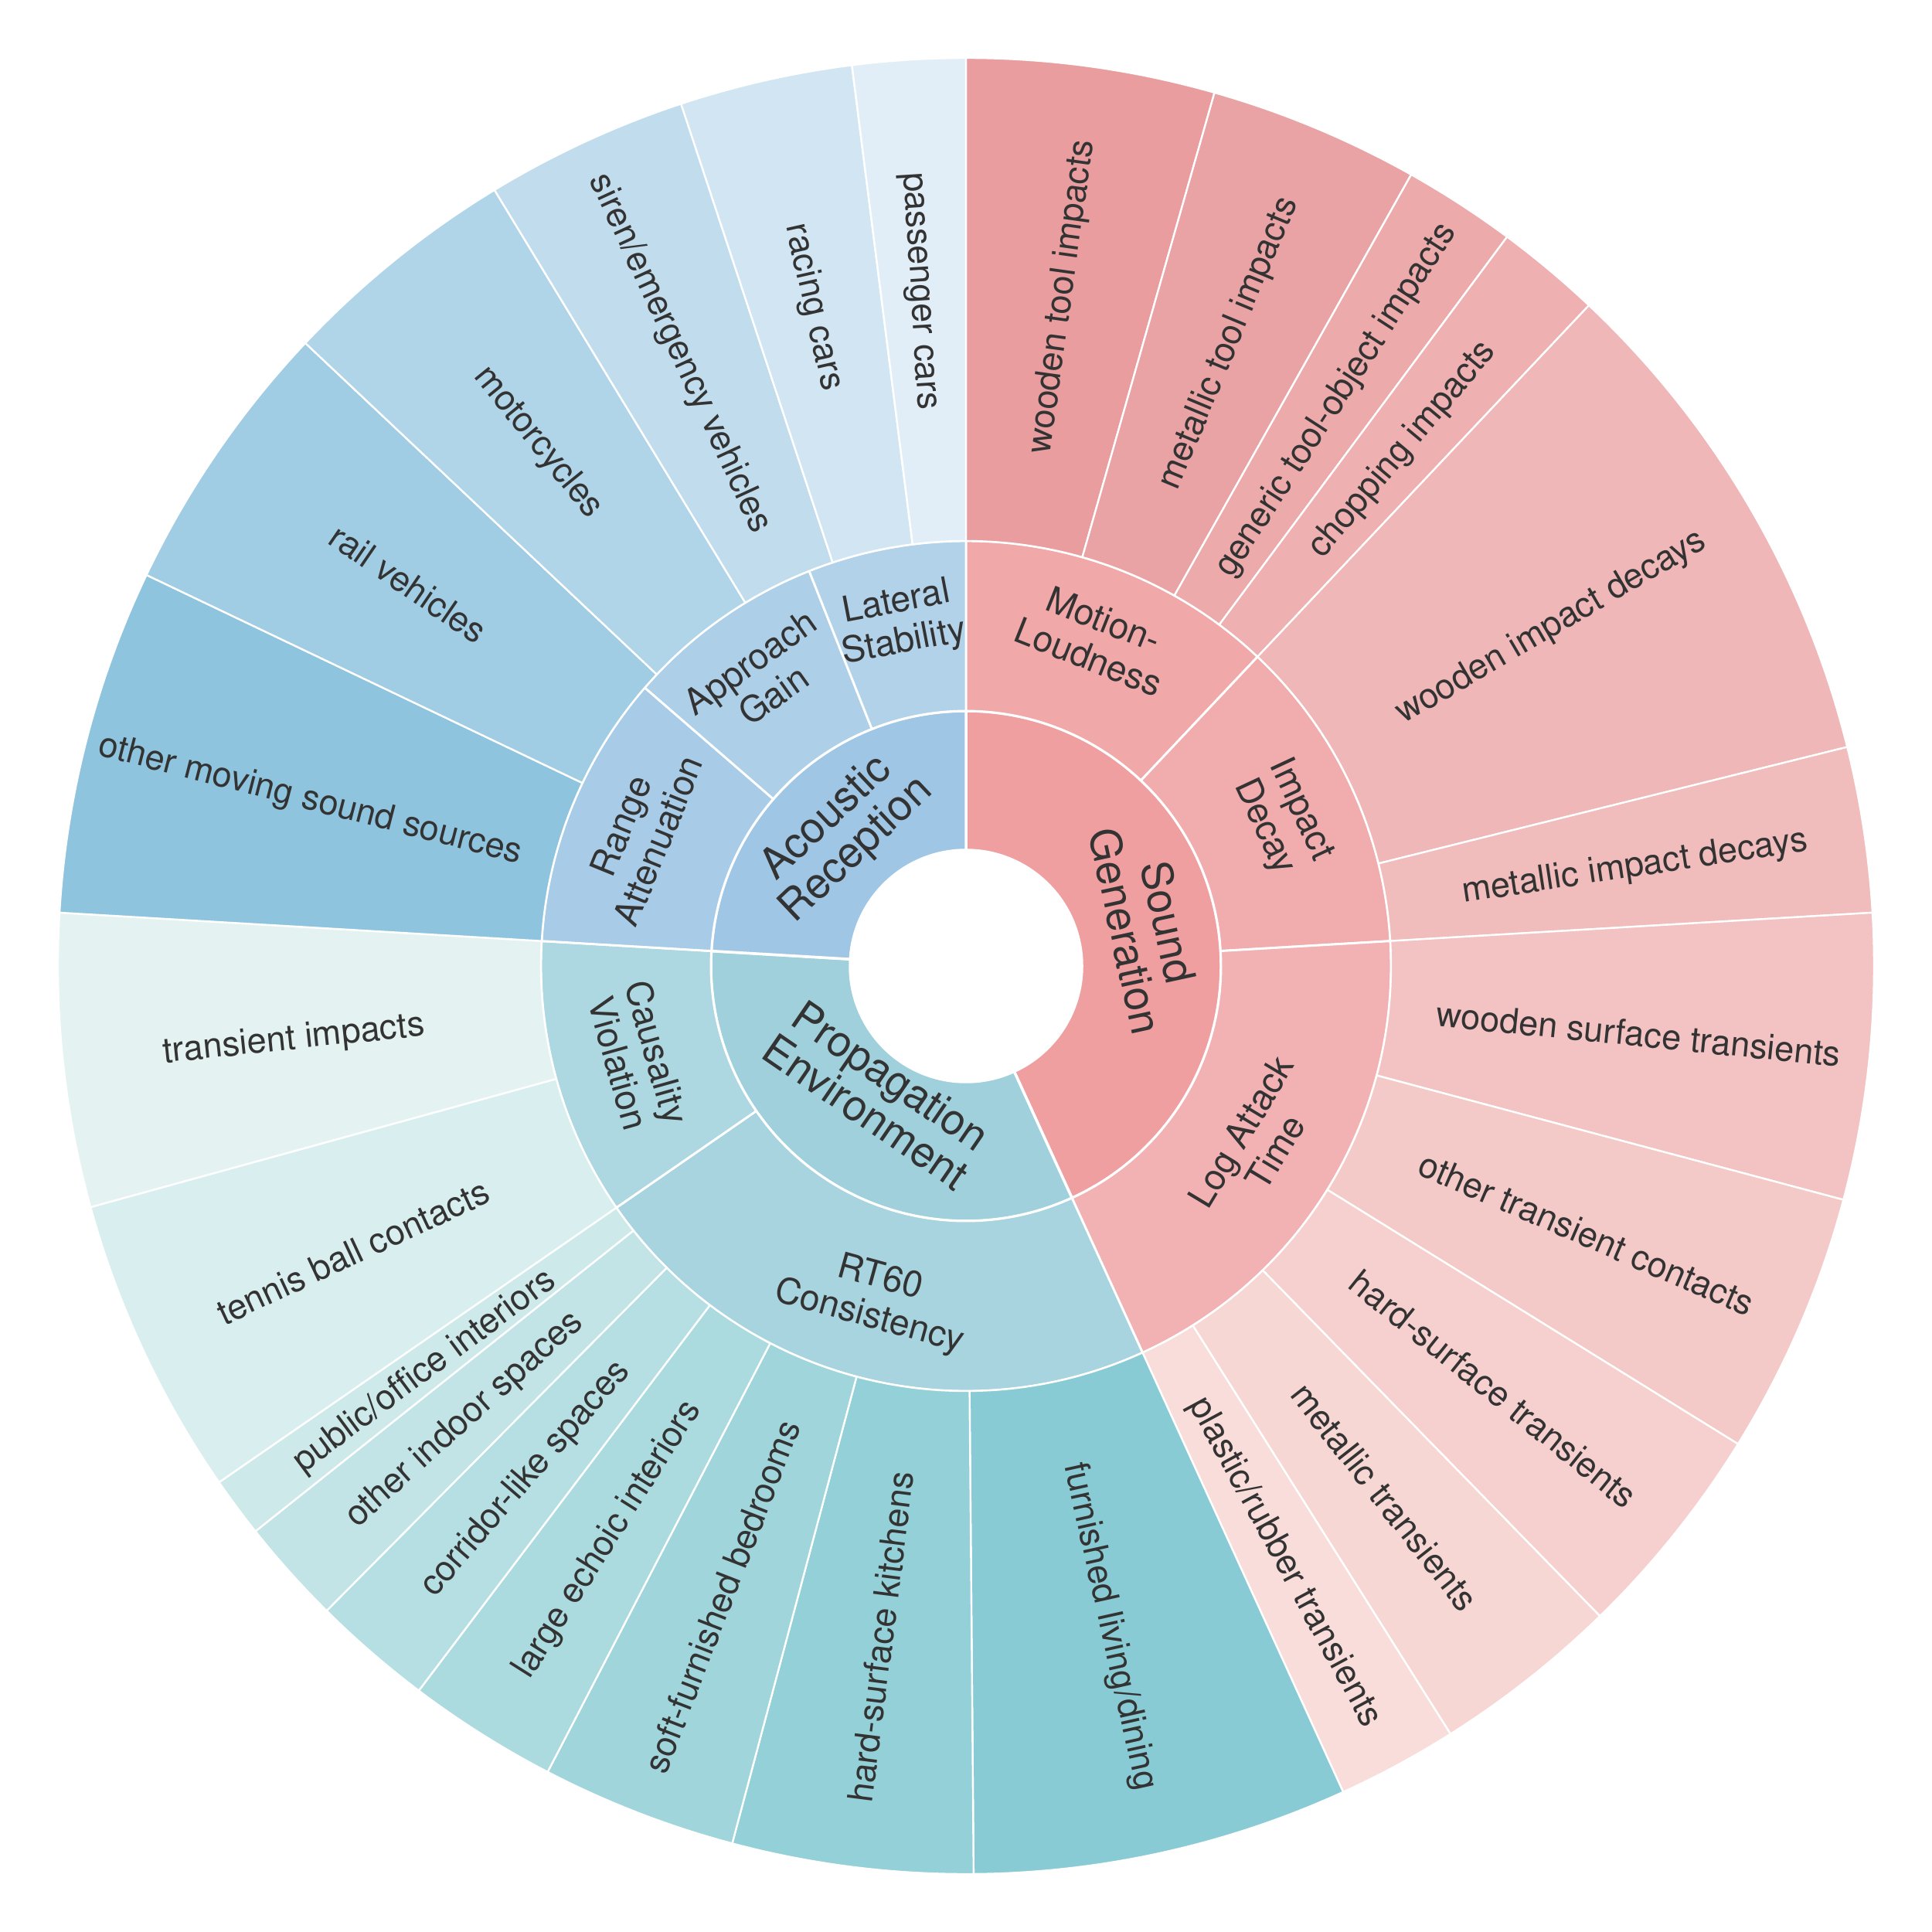
How to read the counts. These totals count unique prompts, not evaluator assignments. Approach Gain and Lateral Stability share the receiver-motion pool; Causality Violation reuses eligible Motion–Loudness and Impact Decay cases; and six Range Attenuation prompts overlap with receiver motion.
02 / Evaluator validation
Across all eight evaluators, we test recovery of expected relations, sensitivity to controlled violations, and agreement with expert judgments. Separate checks probe CPRS complementarity and RT60 transfer.
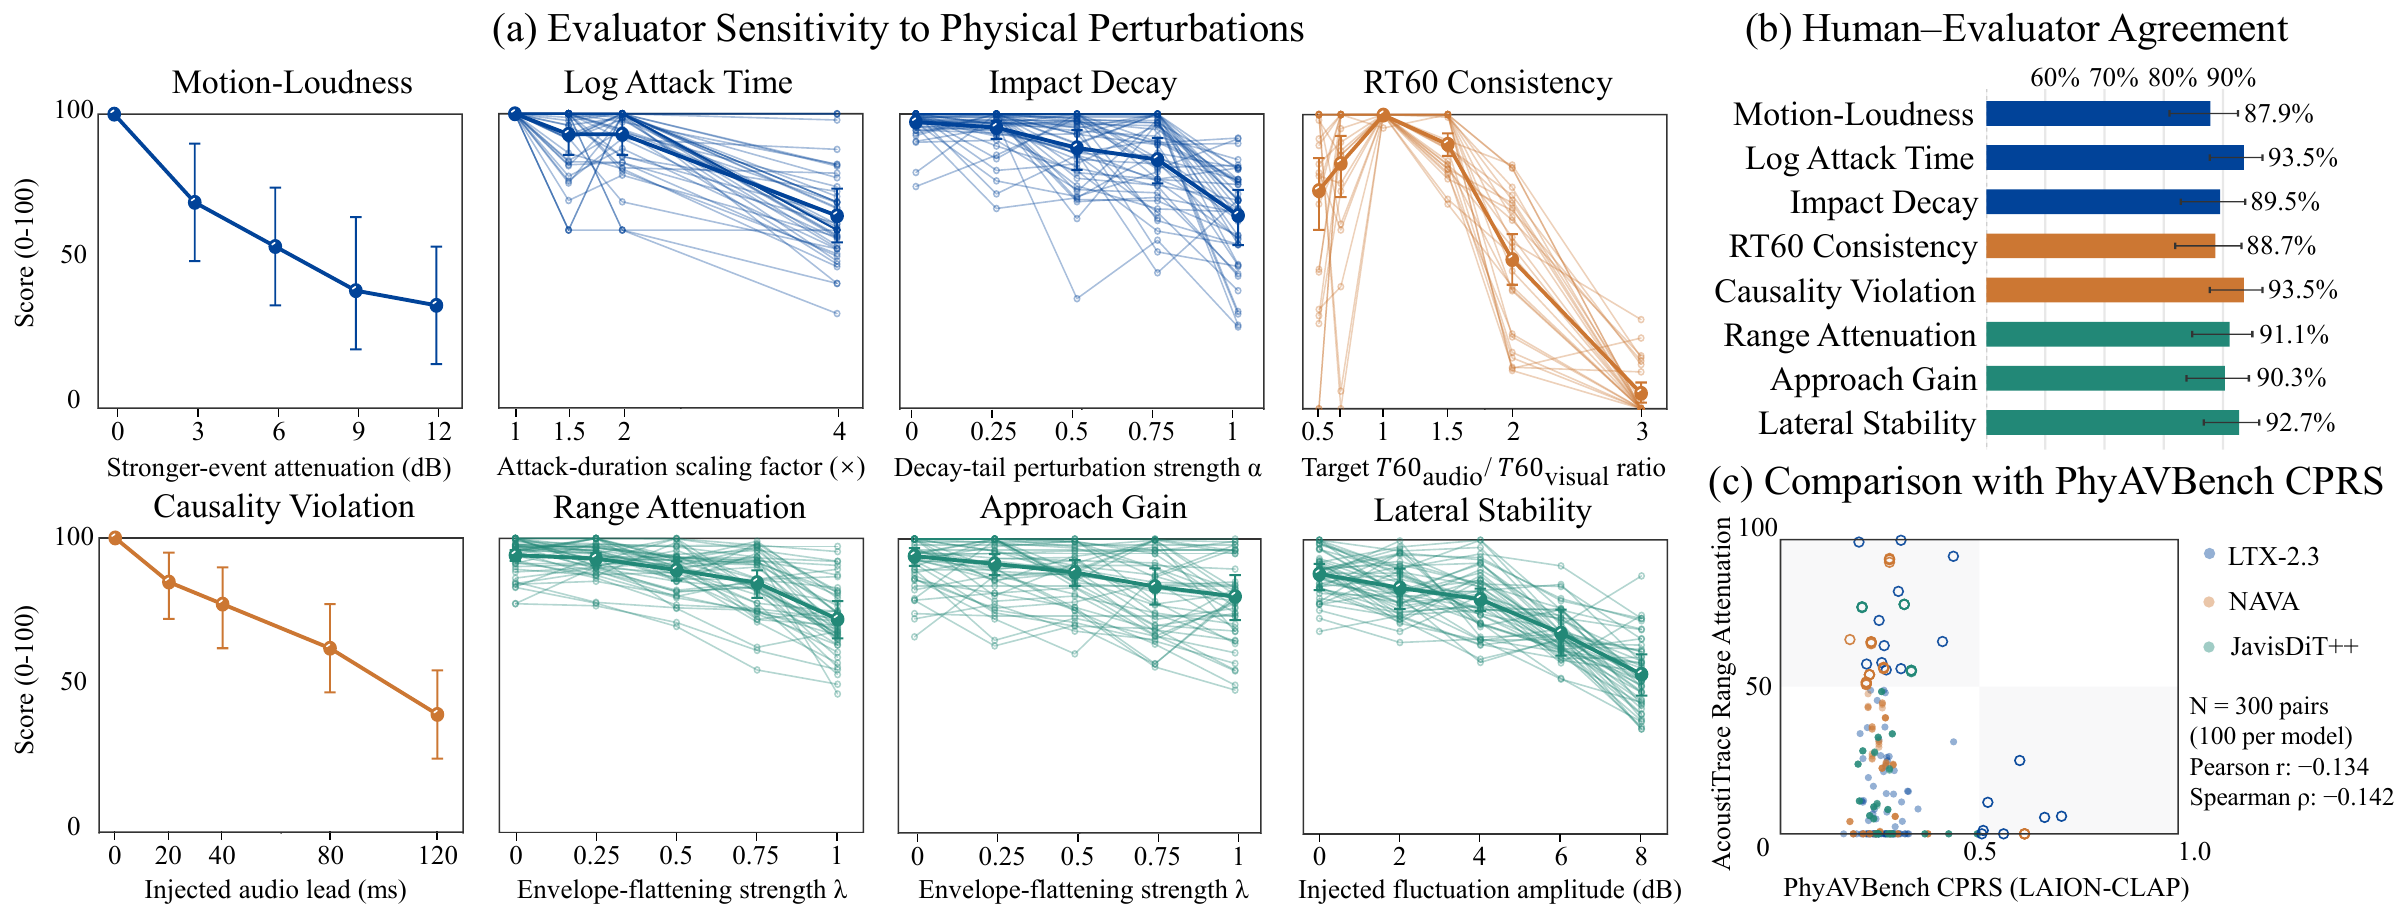
As each targeted acoustic violation becomes more severe, its corresponding consistency score degrades in the expected direction.
Across 1,920 ratings of 64 generated A/V pairs from 30 expert raters, evaluator preferences closely match which output better satisfies the target relation.
Weak correlation with CPRS over 300 near–far pairs shows that embedding transitions and relation-specific acoustic diagnosis measure different properties.
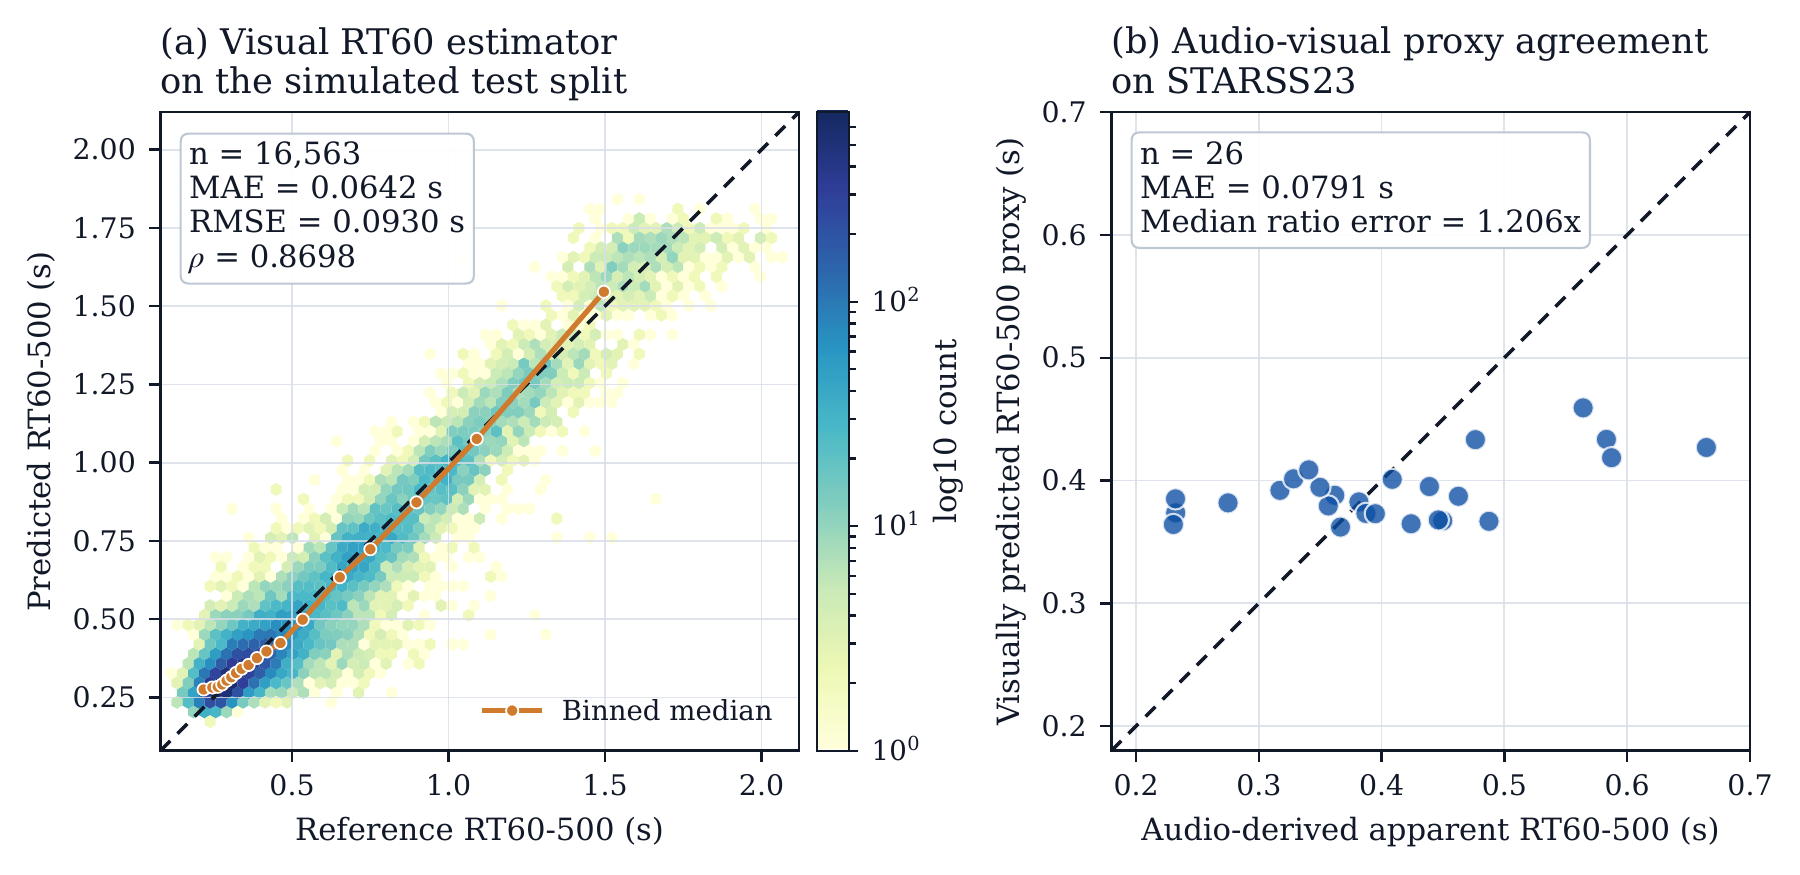
Takeaway. The selected Sabine-guided estimator reaches 0.0642 s MAE and Spearman ρ = 0.8698 on 16,563 simulated observations; across 26 valid STARSS23 clapping windows, the audio–visual proxy MAE is 0.0791 s.
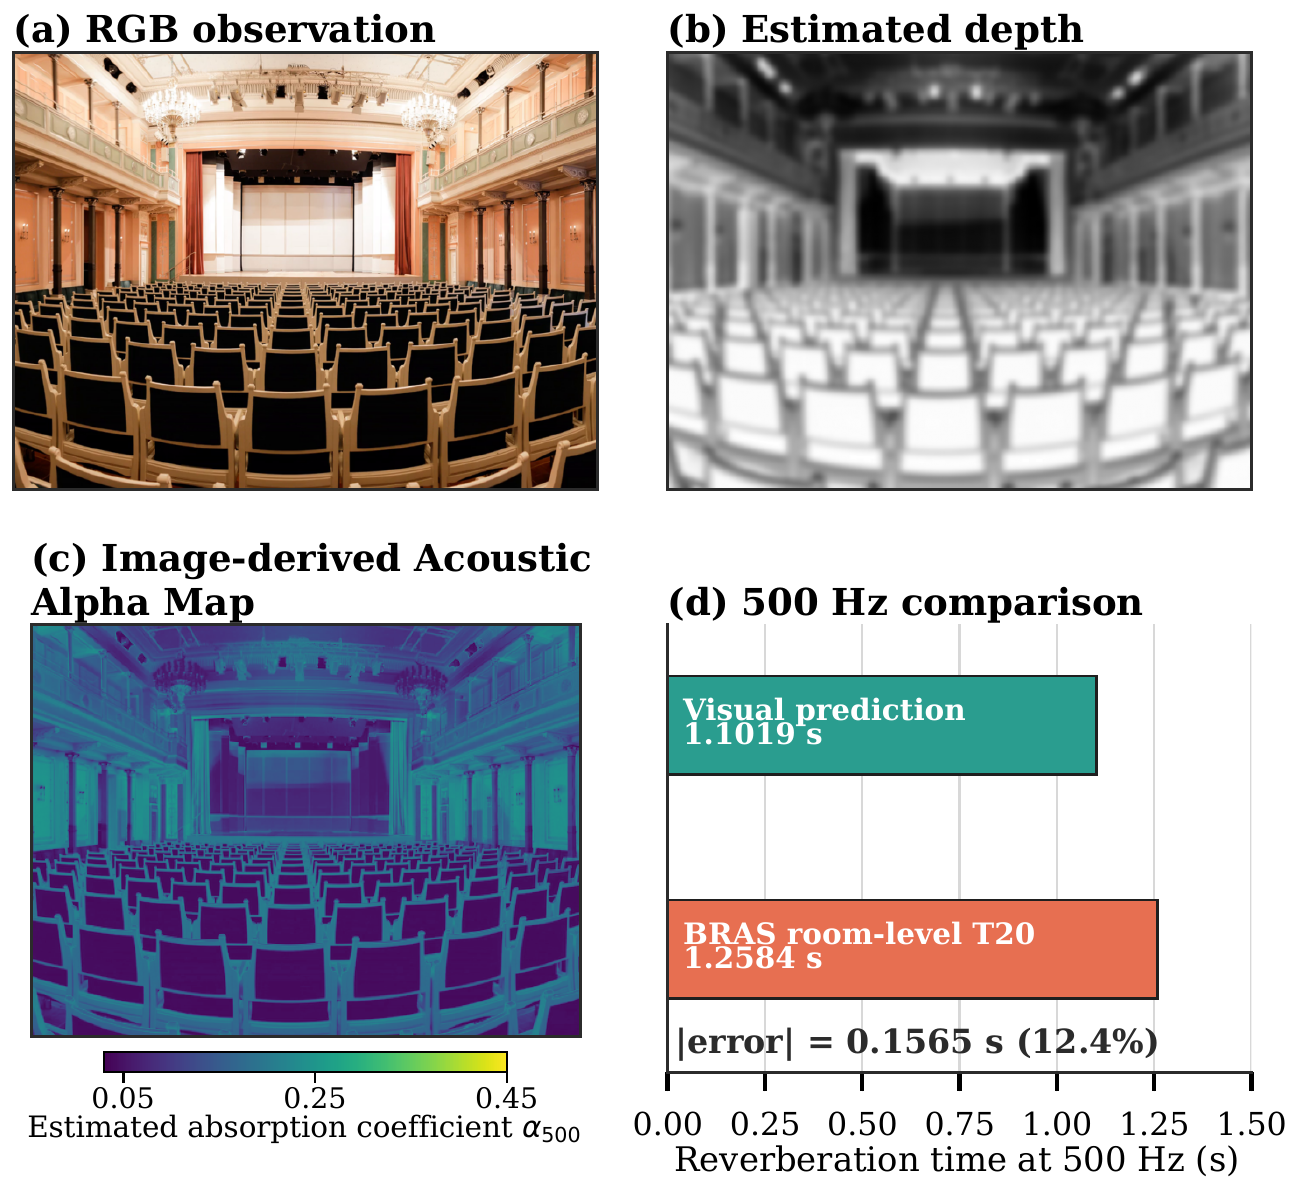
Takeaway. The image-derived estimate is 1.1019 s at 500 Hz versus the official room-level T20 of 1.2584 s—a 0.1565 s difference. This is an illustrative single-room case, not an aggregate BRAS result.
03 / Benchmark results
We compare nine generators using conditional scores on valid outputs. Read each row as a diagnostic profile rather than a single ranking: leadership changes with both the acoustic relation and the generation task.
| Model | Range Attenuation | Approach Gain | Lateral Stability | Motion–Loudness | Impact Decay | Causality Violation | RT60 Consistency |
|---|---|---|---|---|---|---|---|
| LTX-2.3 | 81.6 | 74.1 | 92.2 | 88.5 | 90.0 | 86.5 | 41.1 |
| JavisDiT++ | 39.2 | 68.4 | 87.5 | 51.5 | 73.6 | 86.6 | 69.8 |
| NAVA | 68.1 | 69.9 | 84.4 | 75.9 | 88.6 | 93.2 | 69.7 |
| Ovi | 57.1 | 70.6 | 89.6 | 56.4 | 98.6 | 88.9 | 69.1 |
| UniVerse-1 | — | — | — | — | — | — | — |
| MOVA | 62.4 | 81.1 | 86.8 | 74.0 | 59.1 | 83.3 | 53.6 |
| Veo 3.1official API | 71.8 | 88.7 | 81.8 | 75.1 | 98.6 | 98.6 | 73.5 |
| Seedance 2.0official API | 86.5 | 71.3 | 76.6 | 84.0 | 91.4 | 99.2 | 24.3 |
| Wan 2.7official API | 74.5 | 71.7 | 82.0 | 82.4 | 85.9 | 95.7 | 33.2 |
LTX-2.3, Ovi, Veo 3.1, and Seedance 2.0 each lead at least one acoustic relation.
Short, visibly explicit relations are often modeled more reliably than onset detail, sustained geometry, and scene-dependent reverberation.
Scores are conditional on usable evidence. Median validity is 99.8% across model–evaluator cells, with RT60 showing the lowest coverage.
04 / Qualitative evidence
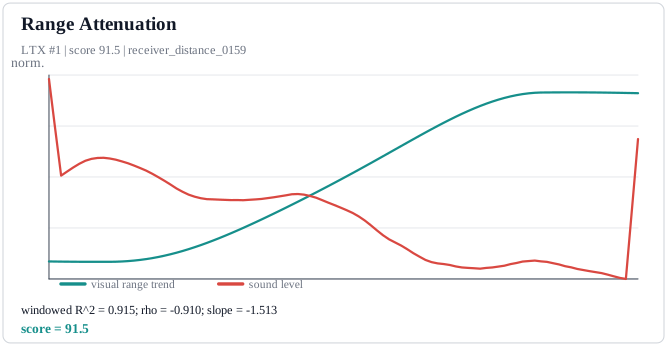
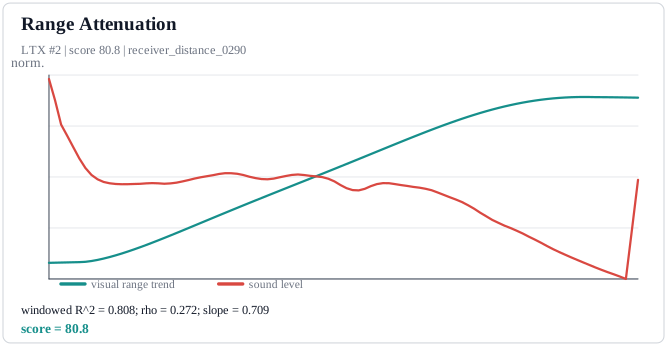
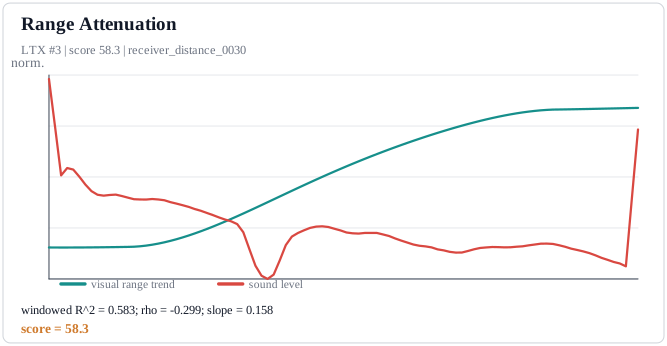
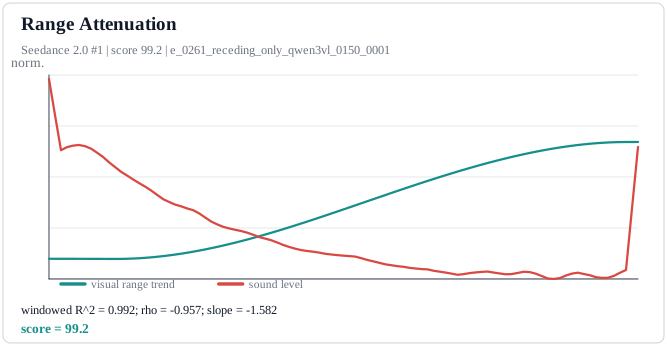
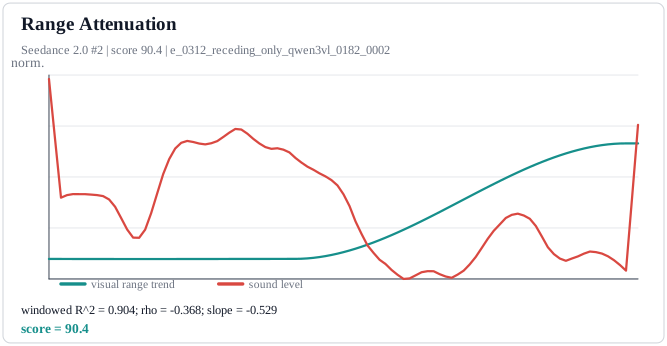
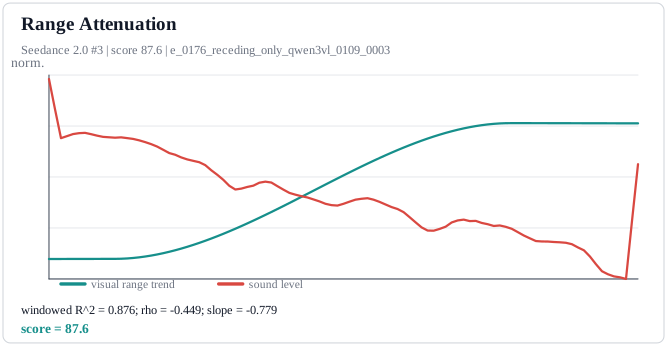
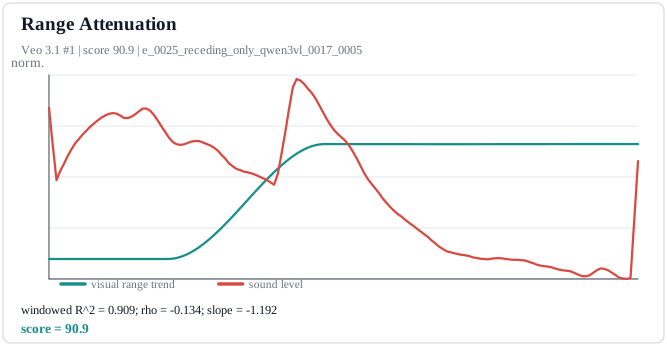
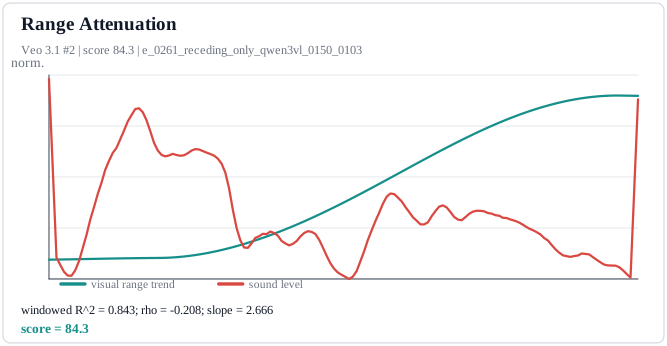
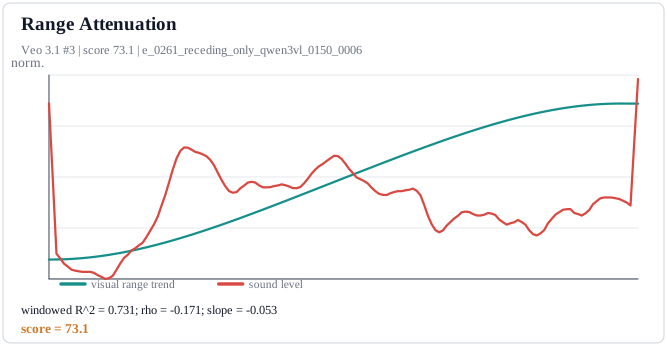
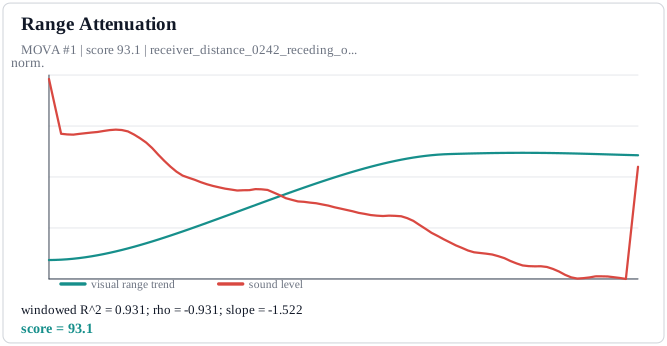
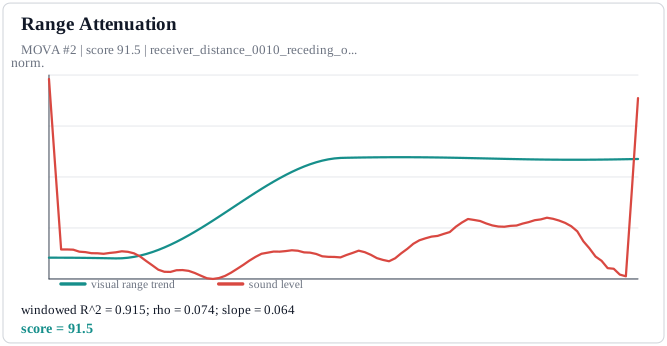
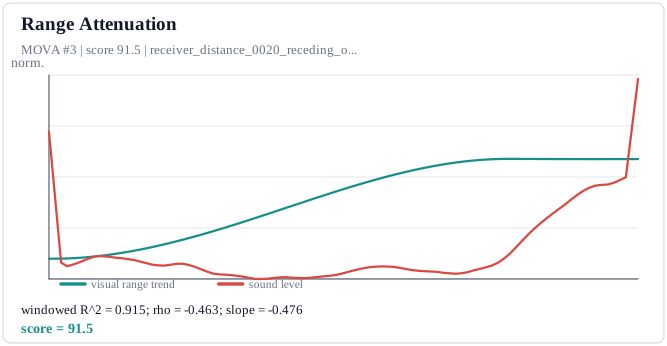
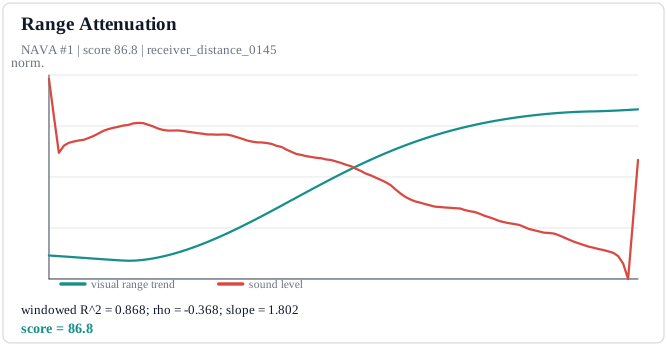
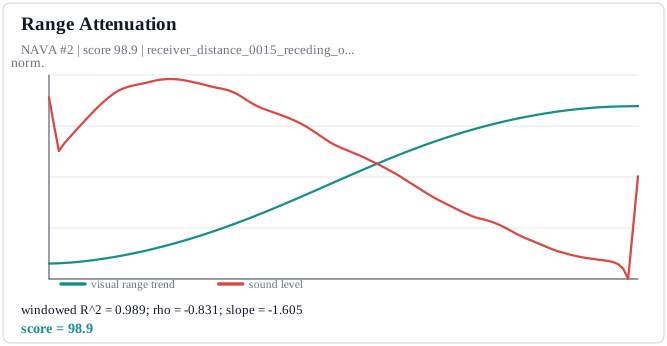
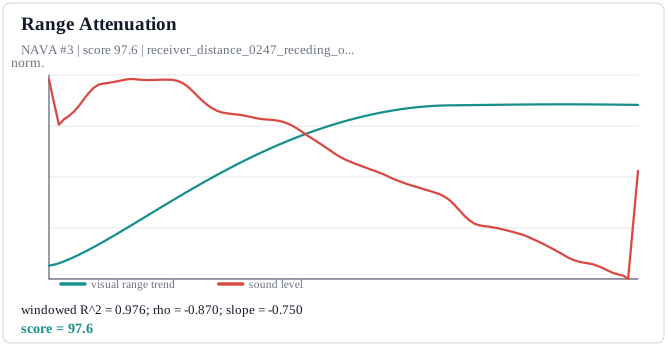
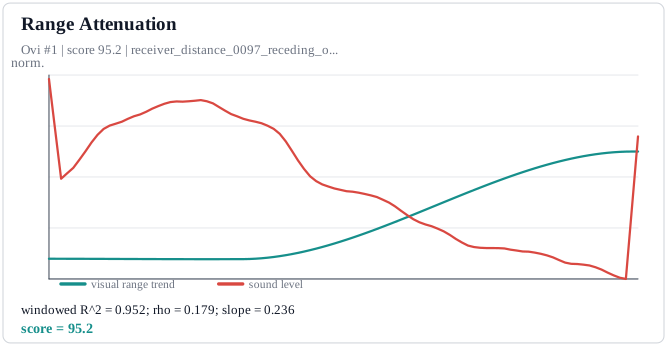
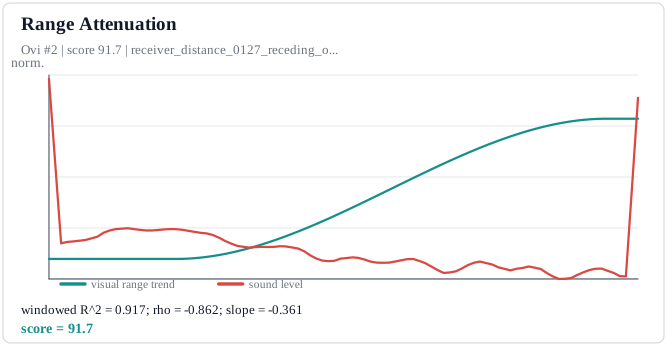
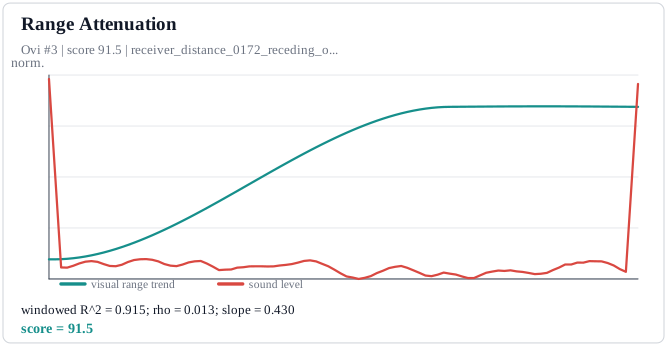
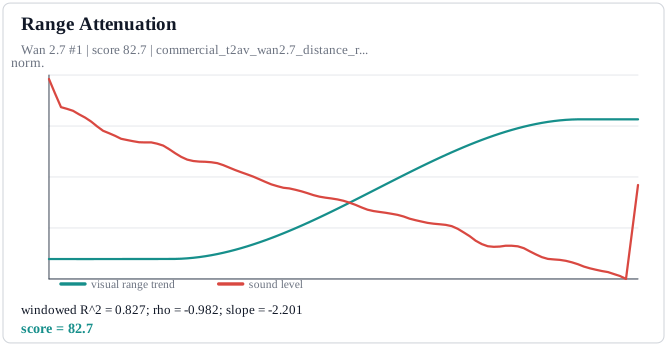
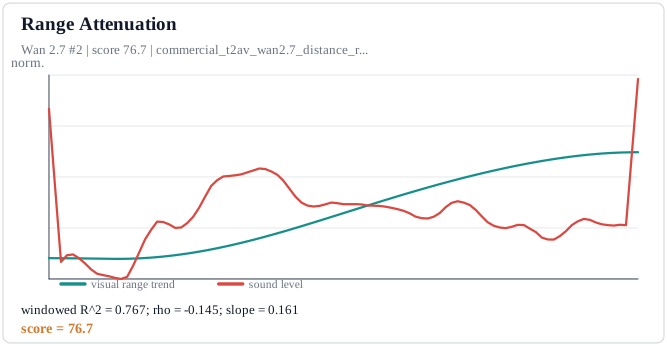
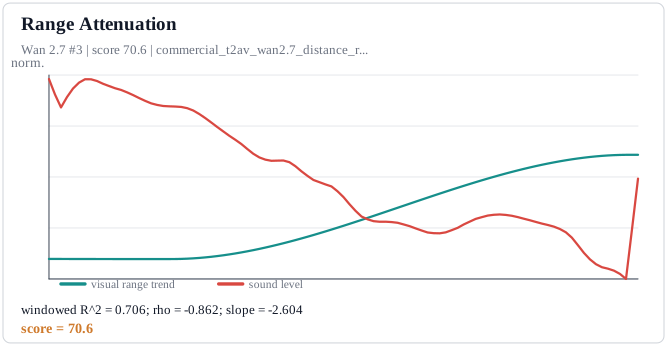
Explore representative AcoustiTrace cases spanning all eight acoustic dimensions. Each generated video is paired with its diagnostic readout.
05 / From diagnosis to intervention
AcoustiTrace does more than rank models. A diagnosed Range Attenuation residual can guide audio denoising while the visual trajectory stays fixed.
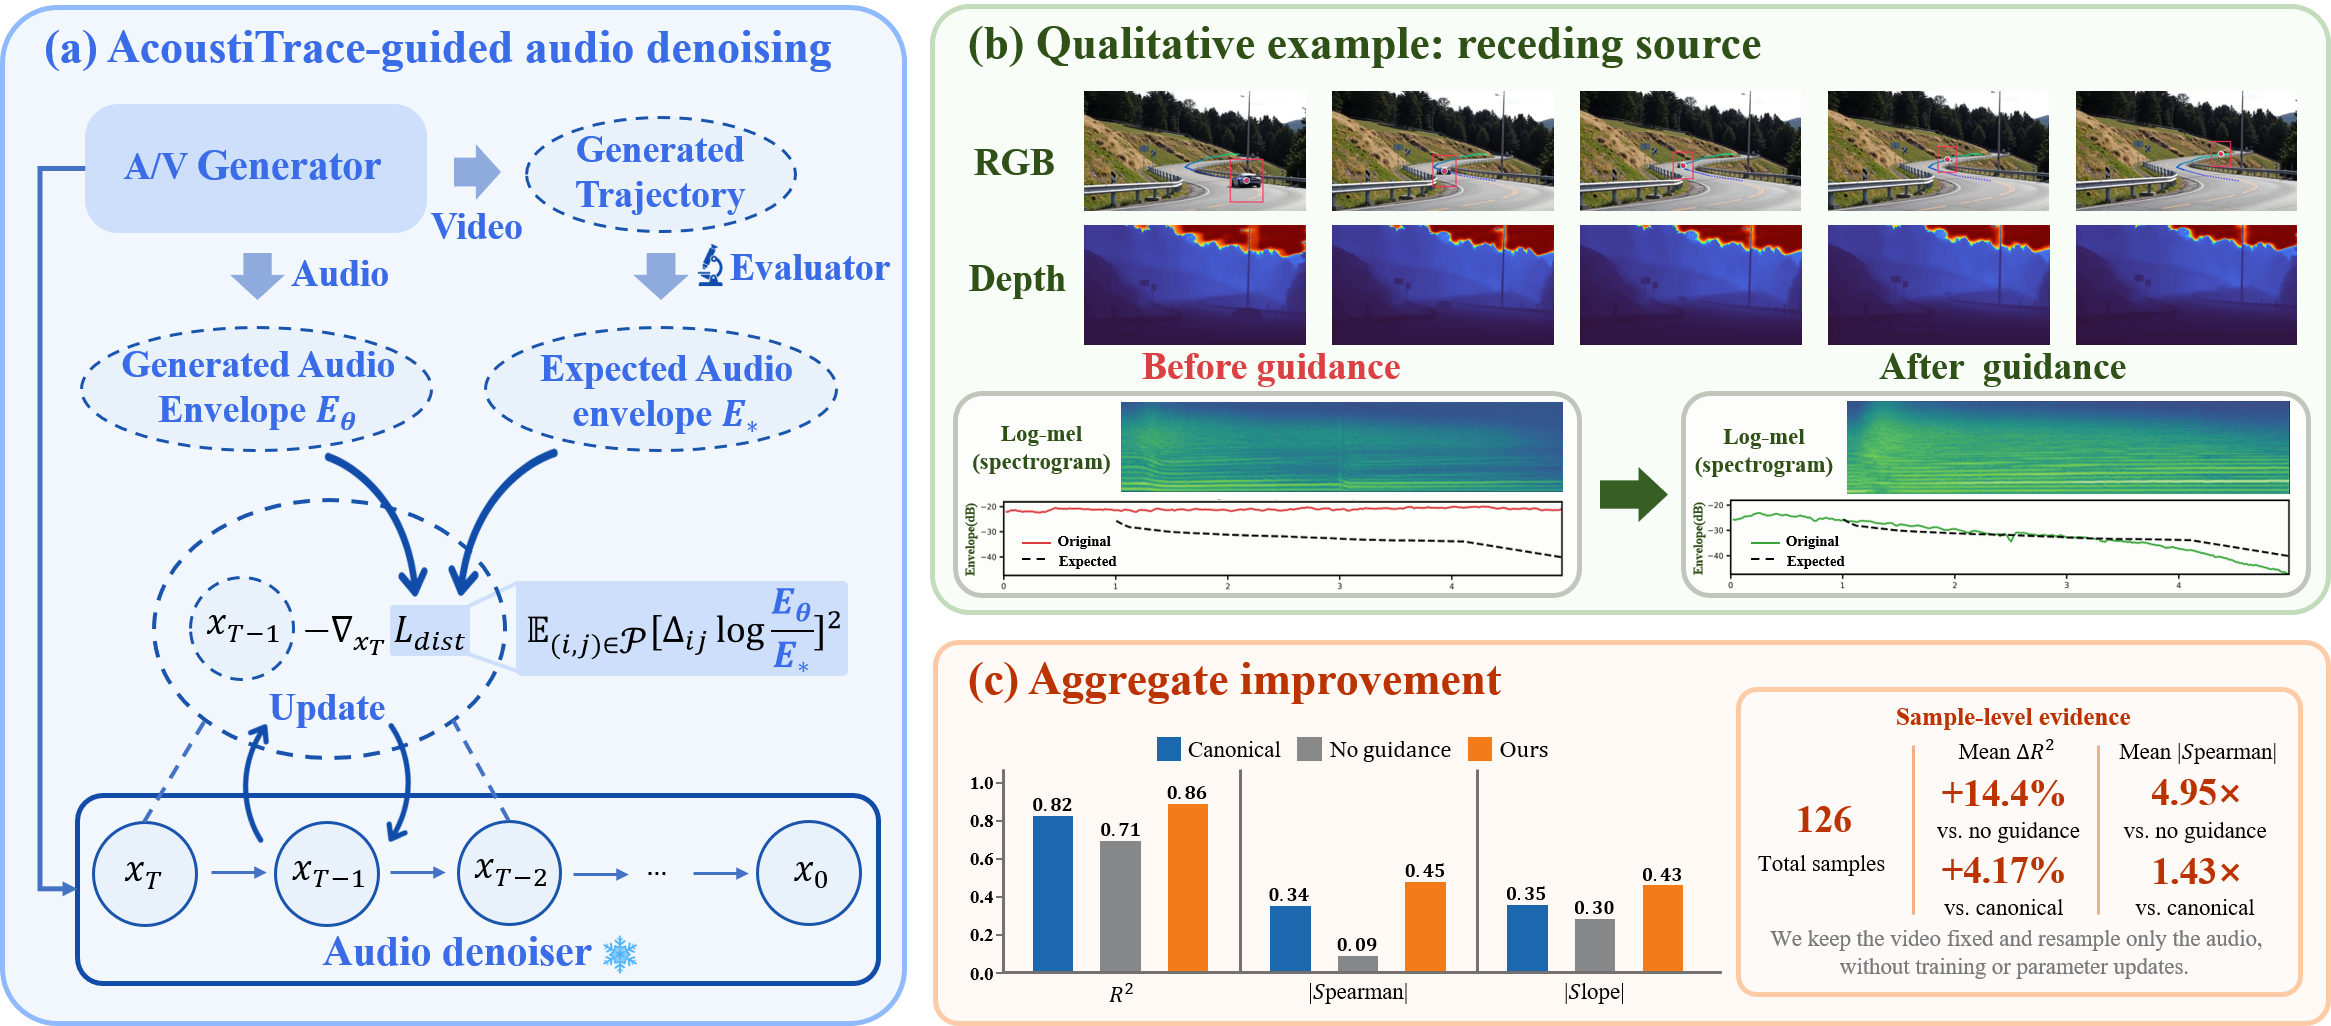
Single-model, single-relation proof of concept. The result demonstrates actionability without claiming a universal guidance method.